


Sebbi Strauch
Candy disappears faster than a ghost on Halloween night — and Americans admit they can’t stop sneaking from their stash.
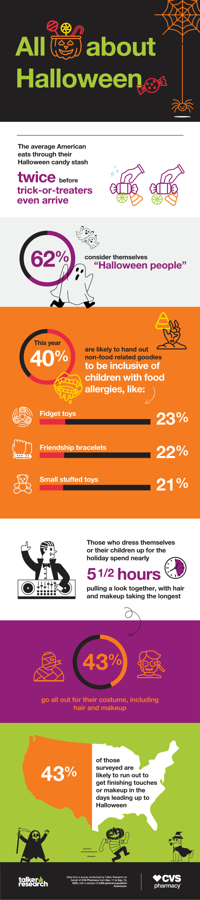
A survey of 2,000 adults found that the average American eats through their Halloween candy stash twice before trick-or-treaters even arrive. One in four confessed they’ve had to restock three times or more (26%).
The survey delved into just how much effort — and temptation — goes into preparing for the holiday.
Conducted by Talker Research on behalf of CVS Pharmacy, results showed that about a third of respondents identify as early planners who stock up and decorate by Oct. 1, while nearly as many admit to being last-minute shoppers.

Half of those who decorate insist that they have the best-looking house on the block (51%).
Despite early intentions, more than half (55%) said they still find themselves dashing out to buy candy at the last minute. And it’s not just candy — 43% of those who dress up also need finishing touches or makeup in the days leading up to Halloween.
“Halloween should be about fun, not stress,” said Brian Eason, vice president of general merchandise and consumables at CVS Health. “Whether you need candy or allergy-friendly treats for trick-or-treaters, last-minute décor, or some finishing touches from the beauty aisle to complete your costume, we’re there to help make it convenient to find everything you need in-store or online down to the day of.”
Getting into character is no small feat, especially since 43% go “all out” for Halloween.
Respondents who dress themselves or their children up for the holiday spend nearly five and a half hours pulling a look together, with hair and makeup taking the longest — showing a growing focus on creative makeup, and reflecting how Halloween has become a stage for self-expression.
Nearly two-thirds of Americans (62%) consider themselves “Halloween people,” with Gen Z and millennials leading the charge.
For these enthusiasts, the season is defined by more than costumes and candy: They prefer sweet snacks (32%) over salty (15%), are twice as likely to identify as introverts and are most often born under the signs of Leo, Cancer or Taurus (10% each).
When asked what makes the holiday special, candy was the top response (42%), followed by costumes (27%), fall atmosphere (23%) and spooky vibes (21%).
Parents also ranked the excitement of their kids among the best parts of the season (23%).
This year, four in ten say they’re likely to hand out non-food goodies such as fidget toys (23%), friendship bracelets (21%) or small stuffed animals (21%), to be inclusive of children with food allergies.
“We’re now in our fourth consecutive year of exclusive partnership with FARE on the Teal Pumpkin Project to help make inclusive treats even easier to find and we know that more and more households are opting to offer treats that every child can enjoy,” said Eason. “Our goal is to help our customers celebrate with ease, convenience and confidence.”

Mary Jane Duford
Survey methodology:
Talker Research surveyed 2,000 general population Americans; the survey was commissioned by CVS Pharmacy and administered and conducted online by Talker Research between Sep. 11 and Sep. 15, 2025.
We are sourcing from a non-probability frame and the two main sources we use are:
- Traditional online access panels — where respondents opt-in to take part in online market research for an incentive
- Programmatic — where respondents are online and are given the option to take part in a survey to receive a virtual incentive usually related to the online activity they are engaging in
Those who did not fit the specified sample were terminated from the survey. As the survey is fielded, dynamic online sampling is used, adjusting targeting to achieve the quotas specified as part of the sampling plan.
Regardless of which sources a respondent came from, they were directed to an Online Survey, where the survey was conducted in English; a link to the questionnaire can be shared upon request. Respondents were awarded points for completing the survey. These points have a small cash-equivalent monetary value.
Cells are only reported on for analysis if they have a minimum of 80 respondents, and statistical significance is calculated at the 95% level. Data is not weighted, but quotas and other parameters are put in place to reach the desired sample.
Interviews are excluded from the final analysis if they failed quality-checking measures. This includes:
- Speeders: Respondents who complete the survey in a time that is quicker than one-third of the median length of interview are disqualified as speeders
- Open ends: All verbatim responses (full open-ended questions as well as other please specify options) are checked for inappropriate or irrelevant text
- Bots: Captcha is enabled on surveys, which allows the research team to identify and disqualify bots
- Duplicates: Survey software has “deduping” based on digital fingerprinting, which ensures nobody is allowed to take the survey more than once
It is worth noting that this survey was only available to individuals with internet access, and the results may not be generalizable to those without internet access.