


A new analysis from Farm Flavor sheds light on the scale of agricultural losses that led the White House this week to announce a $12 billion bailout for American farmers. While 2025’s renewed U.S.–China trade tensions have been widely reported, the full extent of the economic damage has been harder to quantify. Using the latest USDA Foreign Agricultural Service data, Farm Flavor analyzed how deeply exports to China have fallen—and which states and products have been hit the hardest. The numbers help explain why emergency federal support was deemed necessary, and they provide a benchmark for evaluating whether the new $12 billion aid package is enough.
Collateral Damage: The Impact of Trade Wars on U.S. Agriculture


Photo Credit: Jamie Sue Photography / Shutterstock
For U.S. farmers, the trade relationship with China has long been critical, but it is rarely calm. As the largest buyer of American agricultural goods outside of Mexico and Canada, China’s demand for soybeans, grains and meat drives prices across the heartland. However, this reliance comes with significant risks. During the trade war that began in 2018, retaliatory tariffs caused more than $27 billion in U.S. agricultural export losses, according to the USDA.
In 2025, that volatility returned. Throughout the year, renewed geopolitical tensions and shifting trade policies have once again disrupted the flow of goods. While recent diplomatic efforts have cooled some of the immediate heat, the market has shifted; China continues to diversify its supply chains toward competitors in Latin America, leaving American producers to navigate a landscape of uncertainty. The data from earlier this year reveals just how much these renewed tensions have hit the bottom line.
With these stakes in mind, researchers at Farm Flavor – a company that provides news and information about the agriculture industry – analyzed the latest USDA trade data to quantify the extent of the pullback. This report details exactly how much agricultural exports to China have declined, identifying which specific products have taken the hardest hit and which states are shouldering the heaviest economic burden.
Here are the key findings from the report:
- China’s role in U.S. agriculture: In 2024, China imported $24.4 billion in U.S. agricultural products – nearly 14% of total U.S. agricultural exports – making it the country’s largest agricultural trade partner outside North America.
- Sharp decline in 2025: From January through August 2025, U.S. agricultural exports to China fell by 54% compared to the same period in 2024, amounting to a $7.4 billion year-over-year loss.
- Soybeans lead the decline: Soybean exports dropped by $2.7 billion across the entire U.S., accounting for over one-third of the total reduction in export value.
- Regional impact varies: The largest export losses are concentrated in the South, Midwest and West Coast. Louisiana alone saw a $1.9 billion drop in agricultural exports to China, representing 25% of the U.S. total.
Trends in U.S. Agricultural Exports to China

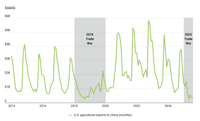
Source: Farm Flavor analysis of USDA Foreign Agricultural Service trade data
Over the past decade, the flow of American agricultural goods to China has shifted from reliable seasonality to stark volatility. From 2014 to 2017, exports followed a predictable rhythm throughout the year, peaking each fall with the soybean harvest. That pattern broke with the onset of the 2018 trade war, then rebounded sharply in 2020 and 2021 after the Phase One trade agreement. With Chinese purchasing commitments in place, monthly exports hit record highs in late 2020 and remained elevated through 2022 – fueling optimism that the relationship had stabilized.
But the landscape began to shift in 2023. Rather than a sudden policy change, American exporters faced structural pressures. Brazil delivered record soybean and corn harvests, undercutting U.S. prices on the global market. At the same time, China accelerated efforts to “de-risk” its food supply, deliberately increasing reliance on South American producers. A slowing Chinese economy further reduced demand, especially for imported feed, compounding the strain on U.S. exporters.
By 2025, these forces – combined with a renewed trade war – converged into a full collapse. After steady declines in 2024, U.S. agricultural exports to China fell by more than half in the first eight months of 2025. The low point came in May, when monthly exports dropped to just $247 million – the lowest level in over a decade.
U.S. Agricultural Exports to China by Product (2025 vs. 2024)

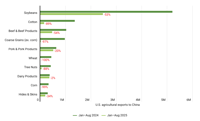
Source: Farm Flavor analysis of USDA Foreign Agricultural Service trade data
An analysis of the top 10 agricultural products by 2024 export value reveals widespread declines across the board in 2025. From January through August, soybean exports fell by $2.7 billion compared to the same period in 2024 – a 53% decline that alone accounted for over one-third of the total drop in trade value. Cotton exports plummeted by nearly 89%, a loss of $1.2 billion, marking the second-largest absolute decline among major products.
Grains also saw substantial disruptions. Exports of coarse grains like sorghum, millet, barley and oats (excluding corn) collapsed by 97%, while corn shipments fell by 99%, representing a combined $1.3 billion decline. Wheat exports dropped to zero during this period, down from $440 million the year prior. These figures underscore a broader breakdown in grain trade, reflecting both Chinese diversification strategies and weakened feed demand.
Other sectors saw smaller but still significant losses. Exports of beef fell by nearly 54%, while pork exports dropped by 20%. Only dairy products remained relatively stable, with a minor 2% decrease year over year.
Changes in Agricultural Exports to China by State

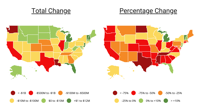
Source: Farm Flavor analysis of USDA Foreign Agricultural Service trade data
The trade downturn in 2025 affected states across all regions, but the largest losses were concentrated in the South, Midwest and West Coast – states heavily tied to bulk commodity exports. Louisiana experienced the greatest absolute decline, with agricultural exports to China down $1.85 billion, largely due to a 48% drop in soybean shipments through Gulf ports. Washington followed with a $1.36 billion decrease, also driven primarily by reduced soybean exports.
Other major exporting states saw similarly sharp drops. Texas exports fell by 80%, with coarse grain shipments to China disappearing entirely. California, historically a key exporter of high-value specialty crops, lost $808 million, led by an 89% drop in tree nut exports. Illinois, another soybean powerhouse, saw total agricultural exports to China fall 67%, resulting in a $545 million loss.
Southern states tied to cotton were also hit particularly hard. Tennessee, Georgia, Mississippi and Virginia all reported total declines between 62% and 92%, with cotton identified as the most affected product in each case. Midwestern states like Nebraska and Kansas suffered steep cuts in beef and coarse grain exports, respectively. In Oregon, wheat exports to China halted entirely.
Only a handful of states saw gains. Michigan led with a $11.3 million increase, driven by increases in soups and prepared foods, followed by smaller upticks in Vermont, New Jersey and Florida. These isolated gains were outliers and not nearly enough to offset the broader trend: most states saw double-digit percentage declines.
For more details on data sources and methods, refer to the methodology section. For a detailed breakdown of U.S. agricultural exports to China by state, see the original report on Farm Flavor: Collateral Damage: The Impact of Trade Wars on U.S. Agriculture.
Methodology


Photo Credit: Jamie Sue Photography / Shutterstock
This report uses data from the U.S. Department of Agriculture’s Foreign Agricultural Service (FAS), analyzing U.S. agricultural exports to China from January through August 2025, compared to the same period in 2024. The timeframe reflects the most recent data available and captures short-term shifts related to ongoing trade tensions. Researchers at Farm Flavor calculated both the absolute and percentage change in export value for each state. States were ranked by total change in export value, and for each, the most impacted product was identified – defined as the agricultural product with the largest drop in export value over the period.
Originally published on farmflavor.com, part of the BLOX Digital Content Exchange.