


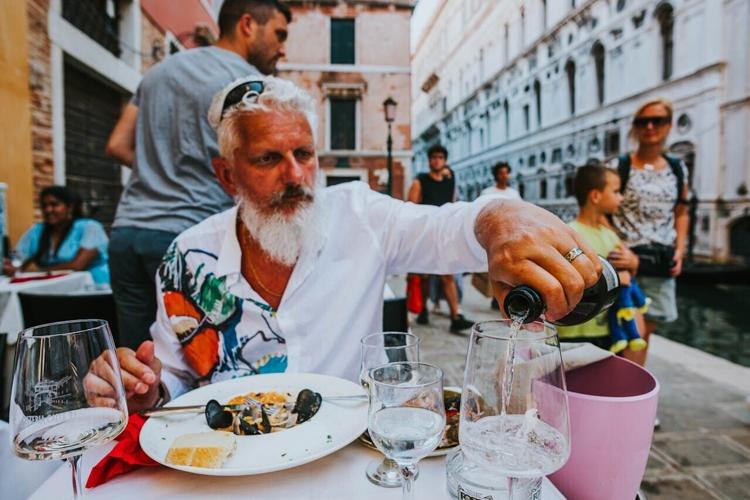


(Photo by Nadin Sh via Pexels)
A fifth of Americans have planned a trip solely for the food, according to new research.
This was revealed in a survey of 2,000 general population Americans, which found 21% of travelers have taken a trip specifically for the food at their destination — with younger generations more likely to have done so.
Forty-four percent of Gen Zers and 31% of millennials surveyed have taken a “foodcation,” compared to 21% of Gen Xers and just one in 10 (11%) baby boomers.
Commissioned by Visit Anaheim and conducted by Talker Research, the survey revealed that, regardless of age, the average respondent traversed 484 miles and spent $910 on their most recent “foodcation.”
But those surveyed would be willing to spend $1,929 — if it meant they could eat something that’s been on their list of foods to try (for example, sushi in Tokyo, curry in Mumbai, etc).
The survey also revealed that respondents believe one visit isn’t enough to “fully experience” the food in a city: This requires five trips to the location.
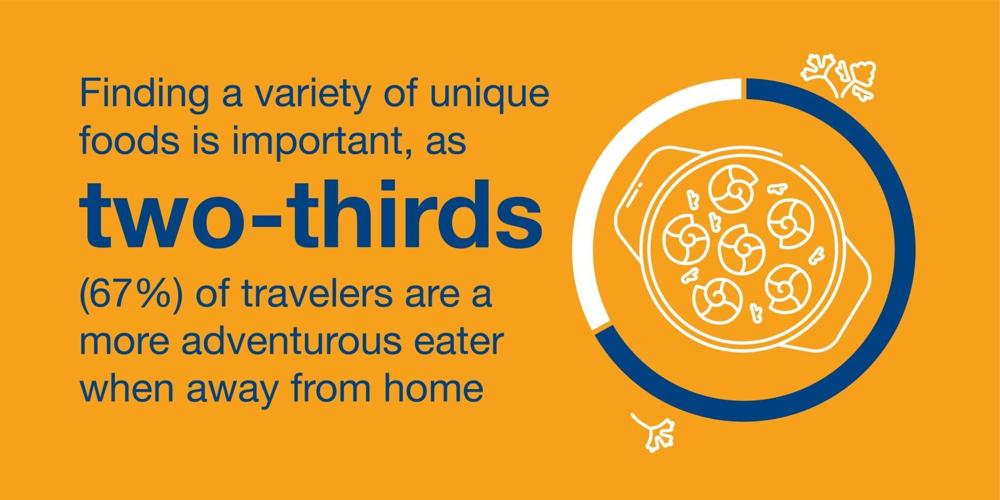
This might be due in part to many people expanding their palates while traveling: Two-thirds (67%) of travelers said they’re a more adventurous eater when away from home.
Younger generations were more likely to become adventurous eaters — over three-quarters (76% of Gen Z and 78% of millennials), compared to 67% of Gen X and 59% of baby boomers.
Regardless of whether respondents are trying new things or sticking to their food routines, three-quarters of respondents will research places to eat in advance of a trip — spending, on average, two-and-a-half hours doing so.

(Photo by Helena JankoviÄová KováÄová via Pexels)
For those who research, they’ll read an average of three articles, watch about seven videos, reach out to three friends and go to four different websites.
“Just as you’d research and plan the attractions you want to see while on vacation, it can be just as fun to map out your meals,” said Scott Oklin, Chief Marketing Officer at Visit Anaheim. “From iconic dishes to hidden gems, a little advanced research and tips from locals when you arrive in a destination can turn dining into one of the highlights of your trip.”
Respondents prefer to find “hole-in-the-wall” places when they’re traveling (41%) instead of “big-name” restaurants (14%) — but 45% admitted they like a mix of both.
The data also revealed the top locations that Americans would travel to, specifically to experience the food. Topping the list was Philadelphia, Pennsylvania, for a Philly cheesesteak.

(Talker Research)
That was closely followed by New York City, New York, for a New York–style pizza — and Missouri and Kansas for Kansas City BBQ.
Rounding out the top five was Chicago, Illinois, for a deep-dish pizza and Central Texas for Texas BBQ.
When asked what state they believe has the best food, New York came out as No. 1 (14%) — but California was a close second (12%), with Texas also not far behind (10%).
“Planning a trip with local cuisine in mind is one of the best ways to experience a destination, with Anaheim and nearby Garden Grove being perfect examples,” added Oklin. “From big-name restaurants to pho in Little Saigon or churros at the Disneyland Resort, dining here connects visitors more deeply to the local community.”
“New York, California and Texas each have rich, diverse food cultures,” said Oklin. “In California, you’ll find everything from California-style pizza to authentic Mexican food in Anaheim, Vietnamese cuisine in Garden Grove and wine in Napa Valley. With so much variety across the state, it’s no surprise California ranks among the states with the best food.”

(Photo by Ketut Subiyanto via Pexels)
TOP “FOODCATIONS” AMERICANS WOULD LIKE TO EXPERIENCE :
- Philadelphia, Pennsylvania;â¯Philly cheesesteak — 27%
- New York City, New York;â¯New York–style pizza — 27%
- Missouri and Kansas;â¯Kansas City BBQ — 26%
- Chicago, Illinois;â¯deep-dish pizza — 25%
- Central Texas;â¯Texas BBQ — 24%
- Memphis, Tennessee;â¯Memphis BBQ — 23%
- Alaska;â¯King crab — 20%
- Boston, Massachusetts;â¯lobster roll (warm with butter) — 19%
- Louisiana; gumbo — 17%
- Southeast;â¯biscuits and gravy — 17%
- Maine;â¯lobster roll (cold with mayonnaise) — 16%
- California;â¯In-N-Out Burger — 16%
- Maryland;â¯Chesapeake Bay crab — 16%
- California;â¯California-style pizza — 16%
- New York City, New York;â¯pastrami on rye — 15%
- Chicago, Illinois;â¯Italian beef sandwich — 15%
- Oklahoma;â¯chicken-fried steak — 15%
- Arizona and New Mexico;â¯Navajo tacos and fry bread — 14%
- Napa Valley, California; wine — 14%
- San Antonio, Texas; Tex-Mex — 14%

XAVIER
Survey methodology:
Talker Research surveyed 2,000 general population Americans; the survey was commissioned by Visit Anaheim and administered and conducted online by Talker Research between Oct. 10–16. 2025.
We are sourcing from a non-probability frame and the two main sources we use are:
- Traditional online access panels — where respondents opt-in to take part in online market research for an incentive
- Programmatic — where respondents are online and are given the option to take part in a survey to receive a virtual incentive usually related to the online activity they are engaging in
Those who did not fit the specified sample were terminated from the survey. As the survey is fielded, dynamic online sampling is used, adjusting targeting to achieve the quotas specified as part of the sampling plan.
Regardless of which sources a respondent came from, they were directed to an Online Survey, where the survey was conducted in English; a link to the questionnaire can be shared upon request. Respondents were awarded points for completing the survey. These points have a small cash-equivalent monetary value.
Cells are only reported on for analysis if they have a minimum of 80 respondents, and statistical significance is calculated at the 95% level. Data is not weighted, but quotas and other parameters are put in place to reach the desired sample.
Interviews are excluded from the final analysis if they failed quality-checking measures. This includes:
- Speeders: Respondents who complete the survey in a time that is quicker than one-third of the median length of interview are disqualified as speeders
- Open ends: All verbatim responses (full open-ended questions as well as other please specify options) are checked for inappropriate or irrelevant text
- Bots: Captcha is enabled on surveys, which allows the research team to identify and disqualify bots
- Duplicates: Survey software has “deduping” based on digital fingerprinting, which ensures nobody is allowed to take the survey more than once
It is worth noting that this survey was only available to individuals with internet access, and the results may not be generalizable to those without internet access.