

Jefferson County students’ performance on the Missouri Assessment Program (MAP) tests in English language arts and math dropped, reflecting the academic struggles students across the state have experienced during the COVID-19 pandemic.
The Festus R-6 School District was the only one of the county’s 11 school district to have more than half of its students score proficient or advanced on the two tests, with 65.1 percent of its students scoring in one of those top two categories in English language arts and 55.6 percent scoring proficient or advanced in math.
“We were very proud of our students,” said Nicki Ruess, the Festus district’s assistant superintendent of teaching and learning. “We anticipated there would be a drop off in scores because of the disruptions, but at Festus, we look at our data and use it consistently and incorporate it in our professional learning communities each week. We gauge learning off the state assessment scores, formative assessments in the classroom to make sure students are learning. That is why we are here.”
Three other county districts had at least half of their students score as proficient or advanced in English – Crystal City with 55.1 percent, Jefferson R-7 with 52.4 percent and Fox C-6 with 50.1 percent.
No other district had half of its students score as proficient or advanced in math.
Hillsboro R-3 had the fewest students score as proficient or advanced in English at 41.4 percent, and Grandview had the fewest students score as proficient or advanced in math at 27.8 percent.
Fewer than half of Missouri students scored at grade level or above in English and math, with 45 percent scoring in the top two categories in English and 35 percent in math. In 2019, the last times students were tested, 49 percent of students scored as proficient or advanced in English and 42 percent in math, according to the Missouri Department of Elementary and Secondary Education (DESE).
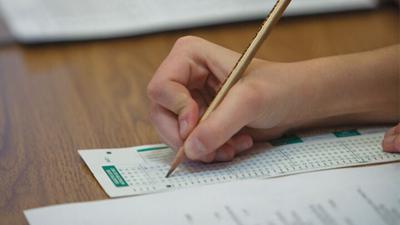
MAP tests score students as either advanced, proficient, basic or below basic in English, math, science and social studies.
The tests were not administered at the end of the 2019-2020 school year after the pandemic shut down school buildings. The 2020-2021 school year test was the first time science scores were calculated after a new test was introduced. Also during the 2020-2021 school year, a new social studies test was used and results were not calculated, according DESE.
DESE officials said the drop was expected since students have dealt with changing school environments and learning from home. Also, both students and teachers have missed time in classrooms because of illnesses or quarantines throughout the pandemic.
State education officials, including DESE Commissioner Margie Vandeven, have urged caution when analyzing the spring 2021 test scores and warned against comparisons to previous years.
“The COVID-19 pandemic presented a number of unique challenges for students, families and schools and educators,” Vandeven said. “Blanket comparisons to previous years’ assessment data that ignores a long list of variables would be a serious misuse of the data.”
The test scores will not be used for accountability measures, including school district accreditation decisions. State education officials said the data can be helpful to understand areas of need and where to allocate federal relief funds.
Here is a look at how county students performed on the test by district:
Crystal City
Crystal City School District students did not perform as well in math as they did on the English test, with 31.3 percent scoring as proficient or advanced and 68.7 percent testing at basic or below basic.
Crystal City had 44.9 percent of students score at basic or below in English, and in science, 43.5 percent scored as proficient or advanced, and 56.5 percent scored at basic or below basic.
“We want to make sure we get the most out of our students, and I think we did in this situation,” Superintendent Matt Holdinghausen said. “Our math scores were something we were working on in 2020 before we had the shutdown. We are redoing our curriculum to make sure it is something that is addressed.”
Holdinghausen said the district focuses more on its internal data collected throughout the school year to determine how students are progressing.
He also said for MAP tests to better reflect student achievement the tests should be taken more than once near the end of the school year.
“The tests are important and a reflection on the district, but is it the best way? I don’t know,” he said. “I think it can be done better than a snapshot, one-day test.”
De Soto
In the De Soto School District, 44.1 percent of students scored at proficient or advanced in and 55.9 percent at basic or below in English. In math, 36.8 percent were proficient or advanced and 63.2 percent basic or below basic, and in science, 41 percent tested at proficient or advanced and 59 basic or below basic.
“The scores fell within the area we expected them to be,” said Ron Farrow, assistant superintendent overseeing curriculum, instruction and assessment. “They were not in the area we would have liked them to be, but certainly, in comparison with state averages, we were there with other schools. We will continue to work on them.”
Farrow said MAP scores are just one piece of the puzzle when judging students’ educational growth, and the district can use the data to help identify what students are struggling with and how the district can adjust how subjects are taught. He also said even though MAP scores are lower than past years, teachers at De Soto and across the state should be proud of the way students performed on the test during an unprecedented pandemic.
“As you look at overall state averages, it is amazing students performed where they did with the new things that were done to teach during the pandemic,” he said. “That is a testament to teachers around the state and specifically to our teachers.”
Dunklin
Dunklin R-5 School District officials said they were proud that 99 percent of the district’s students took the test
“We are proud of the work and effort that our kids, faculty and parents put into this, given all of the circumstances they were faced with each day,” Superintendent Clint Freeman said, “(Students) showed up and competed to the best of their ability.”
Dunklin had 47.2 percent of its students test at proficient or advanced in English and 52.8 percent at basic or below basic. In math, 32.8 percent scored at proficient or advance with 67.2 basic or below basic, and in science, 38.4 percent were proficient or advanced and 61.6 percent basic or below basic.
Assistant superintendent Joe Willis said the district can use the information to look for holes in curriculum, but most changes will be in response to internal testing throughout a school year.
“We have local assessments we use that measure kids more often, and we use that data to drive where our instruction needs to change, what needs to improve or what our kids are missing,” he said. “Sometimes, you can teach a lesson as great as you did before but the kids didn’t learn it the same way, so you have to go back and teach it differently.”
Festus
Festus R-6, the county’s top performing school district, had 34.9 percent of its students score at basic or below basic in English. In math, 44.4 percent tested as basic or below basic, and in science, 47.6 percent were proficient or advanced with 52.4 percent basic or below basic.
“Overall, we were happy,” Ruess said. “The scores show hard work, dedication and deliberate focus from everyone – the teachers, families and students. There were so many distractions and unknowns, and I really feel that deliberate focus from everyone is helping us get through this.”
Ruess said MAP scores are autopsy data that can be used as students progress through the district. She also said it will likely take several years before MAP test scores can be considered a true reflection of student achievement.
“We have to bridge gaps for students who had learning loss, particularly at the lower levels where those foundational skills are so important,” Ruess said.
Fox
The Fox C-6 School District saw 50.1 percent of its students score at proficient or advanced and 49.9 percent test at basic or below basic in English. In math, 35.8 percent tested at proficient or above and 64.2 percent basic or below basic. In science, 42.2 precent scored at proficient or advanced, and 57.8 percent basic or below basic.
Fox Superintendent Paul Fregeau said the district will use the scores as a benchmark and a guide for shaping lessons to maximize student performance.
He also said the scores are just a snapshot of what students know, but it is an important piece of information.
“It’s used in comparison to the rest of the state so we know the importance of it,” he said. “We are accountable for how our kids perform, and we need to do better.”
Fregeau said it will take at least three years before MAP scores truly reflect student achievement.
“I think if we are able to stay in school in a quasi-normal environment for three years, that would be a good place to start identifying trends and what we may be looking at,” he said.
Grandview
The Grandview R-2 School District had 42.7 percent of its students test as proficient or advanced in English and 57.3 percent at basic or below basic. In math, it had the lowest performance with 27.8 precent scoring at proficient or advanced and 72.2 precent at basic or below, and in science, 28.8 percent scored at proficient or advanced and 71.2 percent basic or below.
Superintendent Matt Zoph said the test results were a mixed bag of some grade levels performing better than expected, while other grade levels struggled more than expected.
“I wish I could put my finger on exactly why some did well and some didn’t,” he said. “It is hard to gauge why we did how we did on the tests.”
Zoph said Grandview has focused its curriculum this school year on the priority standards DESE told districts were important to look at, and he said in-school and after-school tutoring is available to help students who are struggling.
He also said next year, middle school students will have an additional hour of math class to help them catch up on concepts they struggled to grasp during the pandemic.
“We realize if you are tested on grade-level standards but you are using most of the year teaching the previous year’s foundation, how well are they going to do on the MAP tests?” We will have extra classes in the core areas to hopefully help kids catch up.”
Hillsboro
The Hillsboro R-3 School District had 41.4 percent as proficient or advanced in English, the lowest percentage of the county’s schools. The district had 51.2 precent score at basic or below. It also had the second lowest performance in math, with 27.9 at proficient or advanced and 72.1 percent at basic or below.
In science, 30.9 percent scored as proficient or advanced, and 69.1 percent scored as basic or below basic.
“Our information reflects the way the entire state achieved on those tests,” assistant superintendent Melissa Hildebrand said. “Obviously, they were not where we wanted them to be, but it is good knowing we performed just as everybody else did with everything that has gone on the past several years.”
Hildebrand said the test scores do not give a true picture of what students are accomplishing at school, and it will take time before MAP scores can give a clearer reflection of what students are achieving.
“It is one week in time out of 170 school days,” she said. “Learning loss will be made up at varying rates depending on each individual kid and their circumstances.”
Jefferson
The Jefferson R-7 School District’s students turned in the third-highest English performance, with 52.4 percent scoring proficient or advanced and 47.6 precent basic or below basic. In math, the district was sixth, with 34.6 percent scoring proficient or advanced and 65.4 percent basic or below basic.
In science, 47.9 percent of students were proficient or advanced, and 52.1 percent were basic or below.
“It is a terrible situation that we live in a world that we want to try to take a test that was administered during unprecedented circumstances and find normal,” Superintendent Clint Johnston said.
He said the MAP information can be used to help identify what students are struggling with, but he is not too concerned about the test results because of the challenges students and teachers faced leading up to the tests.
“We teach children. We don’t teach tests,” he said. “In light of what our district has gone through (when a first-grade student died after being hit by a bus Dec. 21), I’m not real worried about the test. I am worried about making sure we can give (students) the care, character and education that will help them be successful adults and will help them overcome adversity that is more challenging than a test score.”
Northwest
Doréan Dow, the Northwest R-1 School District’s assistant superintendent of secondary schools, said district students performed better than anticipated on the MAP tests, considering the circumstances.
In English, 43.4 percent of students tested at proficient or advanced and 56.6 percent scored basic or below. In math, 37.4 percent were proficient or advanced and 62.6 percent basic or below. In science, 35.7 percent were proficient or advanced and 64.3 percent basic or below.
“We are very proud of our students who persevered through (the pandemic) and continued to give it their best, and our teachers who maintained high expectations,” Dow said. “Overall, we are very pleased to see (Northwest) being very comparable to the state performance.”
Grace Green, assistant superintendent of elementary schools, said student performance has not suffered as much as anticipated, but she also said teachers continue to track students’ progress as the pandemic continues.
“We are not seeing huge negative gaps from year to year, so far,” Green said. “Our teachers are working really hard to identify what students have missed. However, we still have students in and out of quarantine and teachers in and out. We will continue to monitor it for probably the next three or four years.”
Sunrise
The Sunrise R-9 School District, which serves pre-kindergarten through eighth-grade students, had the county’s second-best performance on the math test, with 40.6 percent of students at proficient or advanced and 59.4 percent at basic or below basic.
In English, 47.1 percent were proficient or advanced and 52.9 percent were basic or below basic, and in science, 50 percent of students were proficient or advanced and 50 percent were basic or below basic.
“Considering the circumstances, I think they did about as well as can be expected,” Superintendent Armand Spurgin said. “The last two years, we all know have just been a nightmare for education.”
Spurgin said the district will use the MAP scores to help figure out where students may have fallen behind during the pandemic, and the data also will be used to revise math and science curriculum to help ensure the lessons meet state standards.
He also said he expects it to take at least a couple of years before MAP scores better reflect student achievement.
“I’m sure every school is the same way we are playing catch up with a lot of kids,” Spurgin said.
“It is not (the students’) fault. It is not an effort level. It is not a learning-level problem. They just didn’t get to be here.”
Windsor
In the Windsor C-1 School District, 43.9 percent of its students tested as proficient or advanced in English and 56.1 percent basic or below basic. In math, 30.1 percent of students scored proficient or advanced and 69.9 percent basic or below basic.
In science, 36.2 percent tested as proficient or advanced and 63.8 percent basic or below basic.
Assistant Superintendent Jeff Buscher said the district will not radically change how students are taught based on the MAP scores.
“The best I can tell you, whether we are low or high, we have never been satisfied where we are at and our staff is always looking to make improvements,” he said. “We will use the data to guide us as we go forward developing curriculum and assessing (student achievement).”
Buscher said while the latest scores have to be analyzed with the challenges students and teachers faced throughout the pandemic in mind, the data is still useful to districts.
“It is not to say this is good or bad (information). After shutting down in March (2020) and a year of flex and two days of class and four days class, here is where we are at,” he said. “I think you have to temper all of those things together and create a picture for your staff and community, and you use that as a way going forward.”