


Nationally, plumbers earn about 30% more than the typical worker—but more localized data shows a highly regional industry. We ranked U.S. states and metros according to the median annual wage for plumbers, adjusted for the cost of living.
The Best-Paying Cities for Plumbers


Photo Credit: Photo Credit: Dagmara K / Shutterstock
As artificial intelligence reshapes the job market and the U.S. unemployment rate reaches a four-year high, plumbers and other skilled tradesworkers are seeing growing demand. While many office-based jobs face slowing growth, plumbing continues to offer steady employment and long-term job security.
Plumbing may not be considered a high-profile career, but it remains essential. Plumbers are needed for new construction, routine maintenance, and emergency repairs—services that are always in demand. At the same time, the industry is facing a labor shortage as older plumbers retire and fewer younger workers enter the field.
This report uses the latest data from the Bureau of Labor Statistics and the Bureau of Economic Analysis to examine how plumbing jobs are expected to grow, how wages compare to other jobs nationally, and which U.S. cities offer the best and worst pay for plumbers after adjusting for local cost of living.
Here are the key takeaways from the analysis:
- Plumbers are in demand. Plumbing jobs are projected to grow about 50% faster than the U.S. job market overall.
- Plumbing pays well. The typical plumber earns $62,970 per year or $30.27 per hour, making it one of the top-paid skilled trades.
- Big pay gap by state. After adjusting for cost of living, plumbers in Illinois earn roughly twice as much as plumbers in Florida—$97,314 vs. $48,854.
Plumber Job Growth: Are Plumbers Currently in High Demand?

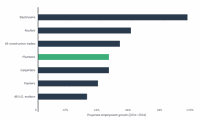
According to the BLS, plumbing jobs are projected to grow about 50% faster than the average across all U.S. jobs.
Source: Construction Coverage analysis of U.S. Bureau of Labor Statistics data | Image Credit: Construction Coverage
Plumbing jobs are expected to grow faster than the national average over the next decade, underscoring the continued demand for this skilled trade. According to the U.S. Bureau of Labor Statistics, employment for plumbers is projected to increase by 4.5% between 2024 and 2034—outpacing the 3.1% growth rate forecast for all occupations across the U.S. labor market.
While the projected growth rate for plumbers lags behind that of the broader construction sector (+5.2%), this slower pace reflects a more stable and steady stream of demand. Unlike some trades that are experiencing rapid expansion driven by specific sectors—such as electricians (9.5% projected growth) benefiting from the growth of data centers, EV infrastructure, and solar energy installations—plumbing tends to see more consistent need across both residential and commercial settings.
Rather than depending on emerging industries or policy-driven investments, plumbing demand is tied to everyday needs. This steadier growth reflects a lower level of volatility, offering job seekers a more predictable employment outlook.
Plumber Salaries: Are Plumbers Paid Well Compared to Other Trades?

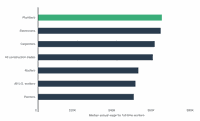
Plumbers earn a median annual wage of $62,970—about 8% more than the average construction worker
Source: Construction Coverage analysis of U.S. Bureau of Labor Statistics data | Image Credit: Construction Coverage
Plumbers earn a median annual wage of $62,970, placing them among the better-paid workers in the construction trades. That figure is about 8% higher than the median wage across all construction occupations ($58,360), and nearly 27% higher than the median wage for all U.S. workers, which stands at $49,500.
Compared to related trades, plumbers earn slightly more than electricians ($62,350) and significantly more than carpenters ($59,310), roofers ($50,970), and painters ($48,660). While wage differences across trades can reflect varying levels of specialization and risk, these figures highlight plumbing as one of the more financially rewarding paths within the skilled labor sector.
Importantly, becoming a plumber does not require a four-year college degree. Instead, aspiring plumbers can pursue training through affordable trade schools or apprenticeship programs that offer hands-on experience while earning a wage. This combination of relatively high pay and accessible training makes plumbing an appealing option for those looking to avoid student debt while entering a high-demand field.
Regional Differences: Plumber Salaries by State

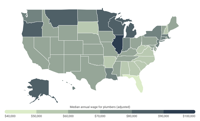
Real plumber wages range from a high of $97,314 in Illinois to a low of $48,854 in Florida
Source: Construction Coverage analysis of U.S. Bureau of Labor Statistics and U.S. Bureau of Economic Analysis data | Image Credit: Construction Coverage
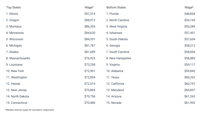
After adjusting for cost of living, plumber salaries vary widely across the United States. At the top of the list is Illinois, where plumbers earn an adjusted median wage of $97,314—nearly double the adjusted wage at the bottom of the rankings in Florida ($48,854). Illinois and Florida are also the top- and bottom-paying states for construction workers overall.
Most of the top-earning states are located in the northern half of the country, including Midwestern states like Illinois ($97,314), Minnesota ($84,620), Wisconsin ($84,331), and Michigan ($81,787). Colder climates in these regions may contribute to higher demand for plumbing services, particularly for winterization, repairs, and emergency work, which can drive up wages. Western states like Oregon ($88,912), Montana ($86,355), and Alaska ($81,689) also rank highly, possibly due to a combination of labor shortages, strong union representation, and higher baseline wages in rural or remote areas.
By contrast, Southern states tend to offer the lowest adjusted wages for plumbers. Florida ($48,854), North Carolina ($54,165), West Virginia ($55,284), and Arkansas ($57,451) all fall in the bottom five. This may reflect lower union density, lower prevailing wage standards, and generally lower labor costs in the region. Still, growing populations and ongoing construction activity may create steady work opportunities, even in lower-wage markets.
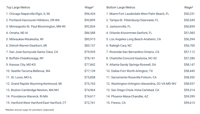
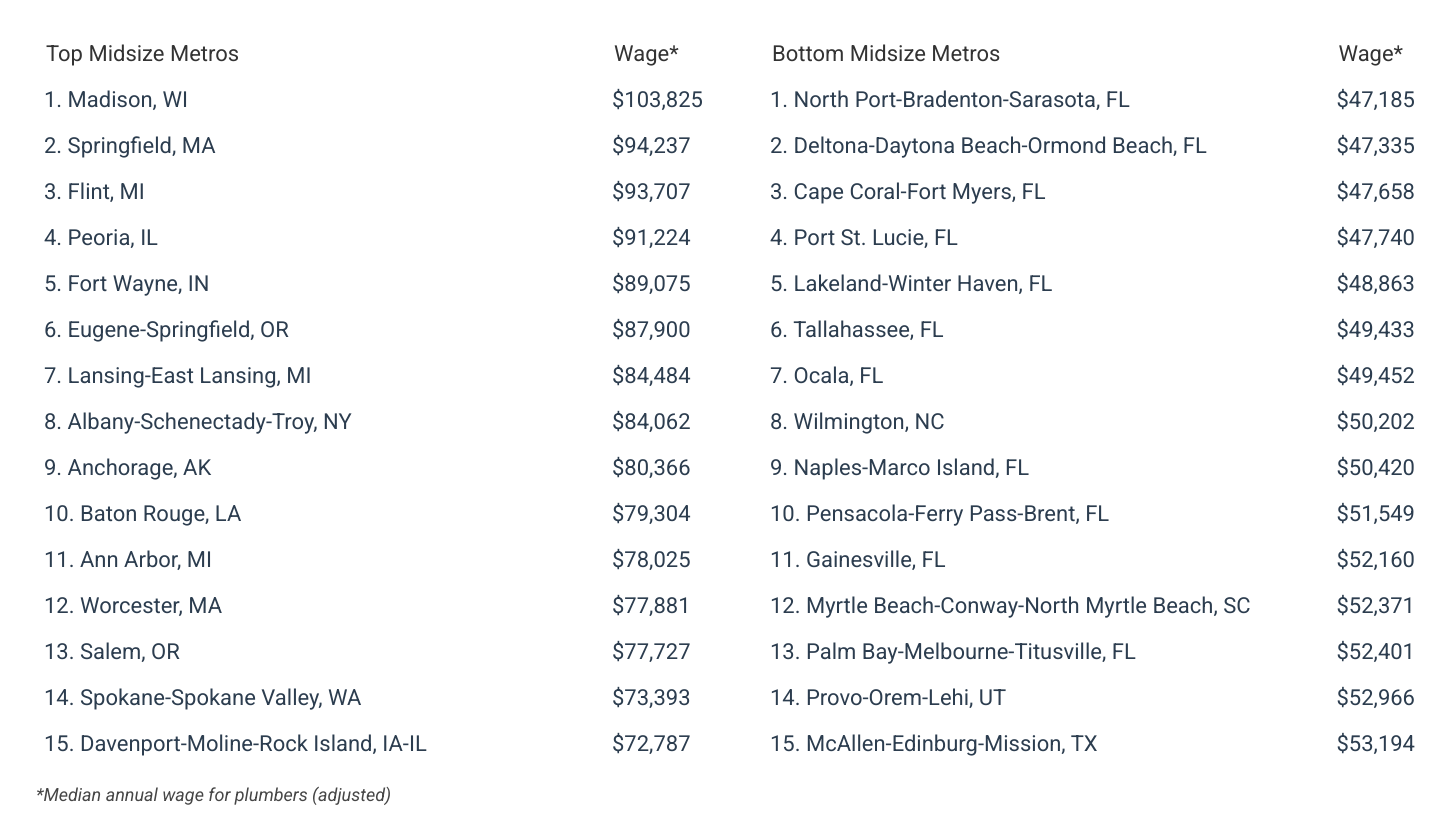
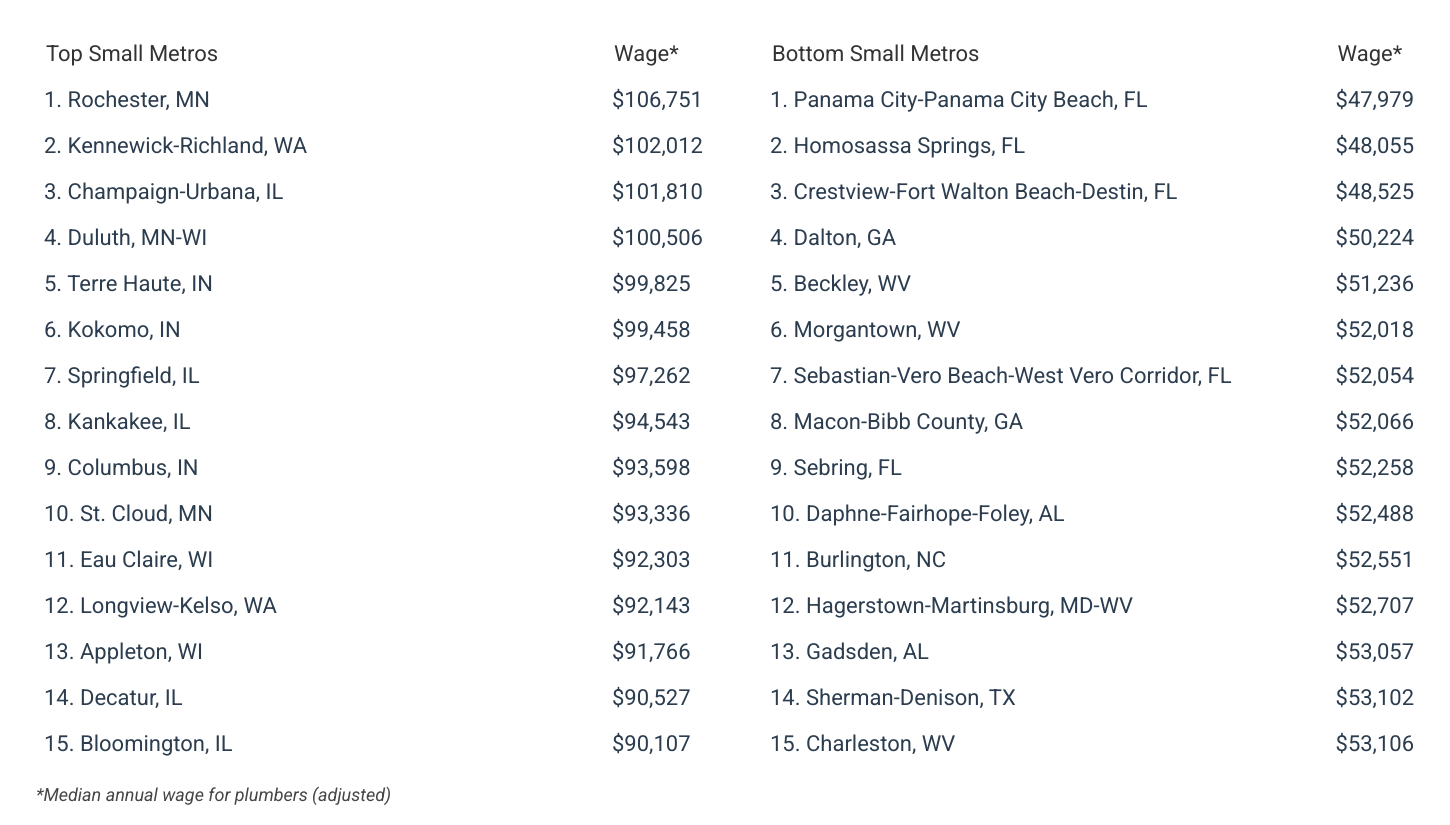
Similar trends hold at the local level, with many metropolitan areas in the Midwest and West ranking highly for plumbers’ wages. In the top metros, including Rochester, MN ($106,751), Madison, WI ($103,825), and Kennewick-Richland, WA ($102,012), the typical plumber can expect to earn well over $100,000 per year after adjusting for living costs. These high-paying areas often share two characteristics: relatively high unionization rates and moderate to low costs of living—factors that together contribute to stronger real wages for skilled trades.
The analysis was conducted by Construction Coverage—a publication offering construction pros research on wages, job growth, and economic conditions—using data from the U.S. Bureau of Labor Statistics and the U.S. Bureau of Economic Analysis. For a complete breakdown of plumber wage and employment statistics for all major U.S. metropolitan areas and all 50 states, see The Best-Paying Cities for Plumbers on Construction Coverage.
Best-Paying Cities for Plumbers

Best-Paying States for Plumbers

Methodology


Photo Credit: Photo Credit: Dagmara K / Shutterstock
To find the best-paying locations for plumbers, researchers at Construction Coverage used wage and employment data from the U.S. Bureau of Labor Statistics (BLS) 2024 Occupational Employment and Wage Statistics (OEWS) program and cost-of-living data from the U.S. Bureau of Economic Analysis (BEA) 2023 Regional Price Parities dataset.
For each location, the median annual wage for plumbers was adjusted according to the relative cost of living. In locations with higher living costs, wages were adjusted down to reflect lower purchasing power, while wages in locations with lower living costs were adjusted up to reflect greater purchasing power. Researchers also calculated the relative concentration of plumbers in each location, which is the location’s percentage difference from the national concentration (measured as the total number of plumbers divided by the total number of workers across all occupations).
Only locations with available data from both the BLS and BEA were included in the analysis. Additionally, metropolitan areas were grouped into cohorts based on population size: small (under 350,000), midsize (350,000–999,999), and large (1,000,000 or more).
For complete results, see The Best-Paying Cities for Plumbers on Construction Coverage.
Originally published on constructioncoverage.com, part of the BLOX Digital Content Exchange.